Many people/analysts believe that practicing Elliott wave principle is difficult and the study of this principle is complicated and rather the principle is subjective. If we study whole of the subjects of technical analysis, they are subjective in nature and every analyst have his/her own technique to use that particular study. And, that’s where we call technical analysis, an art instead of science/subject matter. Yes, I agree that the principle is wide enough and sometimes, you would not be able to mark a correct Elliott wave count because of limited knowledge about it.
I would try to point out some of the myths in this part that majority of analysts do while making Elliott wave counts or forecasting based on Elliott wave principle.
Every price chart could not contain motive/impulsive wave
The most common mistake which an analyst does is that they always try to mark everything as impulsive wave viz. 1-2-3-4-5. And, in that process till the time we have marked wave 3, we always anticipate wave 5 after a minor correction in the form of wave 4 (in assumption) which never happens and we start losing hope/faith in the study.
We have read in many books teaching technical analysis that market trends 20% of times. So, how can we always mark everything as impulsive waves? An impulsive wave can be a part of larger corrective structure and markets/asset prices can continue to move higher as much as they want to even in larger corrective structures.
There is a difference between trend, correction and corrective waves
A trend is simple formation of higher highs and higher lows (uptrend) or lower highs and lower lows (downtrend) or higher high and lower low and lower high and higher low (sideways). However, a sideways trend can be defined in many different ways.
A correction is defined as a counter-trend move. For example, a short term fall in any asset will be a correction in larger uptrend or vice-versa. But, in that short term fall, a downtrend or sideways trend can exist.
Corrective waves/structures of Elliott wave principle are defined by many across the web. A bull or bear rally can always be spotted in the form of corrective structures for an indefinite period of time. For example, on monthly charts, an up move started from a triple zig-zag corrective structure can be a part of a larger double three correction and the largest triple three correction trending upwards could not even end in decades and we could not even imagine the magnitude of appreciation in the prices of asset.
So, corrective waves can exist in the form of uptrend/downtrend for an indefinite period of time.
Elliott wave principle is a trading methodology
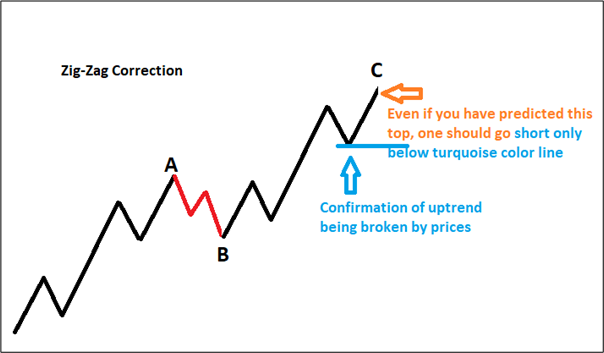
Elliott wave principle is a forecasting/projecting technique and helps you to call short and long term tops and bottoms on price charts. But it is not written anywhere that a trader has to sell at the exact projected top or buy at the exact projected bottom. The theory always warns us about the crucial levels from where prices can reverse their direction. But a trade should always be taken considering the fact that it should be with the trend. Till the time price doesn’t reverse from your projected top and gives a confirmation of break of an uptrend, a trader should not enter short positions.
Let us understand with the help of following chart as an example:
Warning: Investments in securities market are subject to market risks. One should back-test the above discussed strategy and understand all the risks involved in options trading. Consult your financial advisor before acting on the mentioned strategy.
For more information, read our full disclaimer.